
 Colin Logan, Head of Data and Accountability SSAT, writes…
Last week Nicky Morgan, the Education Secretary, announced her definition of what constitutes a coasting school and declared ‘I’m unapologetic about shining a spotlight on complacency and I want the message to go out loud and clear, that education isn’t simply about pushing children over an artificial borderline… for too long a group of ‘coasting’ schools, many in leafy areas with more advantages than schools in disadvantaged communities, have fallen beneath the radar.’
But does the definition match the rhetoric? The criteria will cover a 3-year period from 2014 to 2016 but ‘In 2014 and 2015 that level will be set at 60% of pupils achieving 5 good GCSEs or an above-average proportion of pupils making acceptable progress’.
Put another way, to be identified as coasting, a school would be getting less than 60% 5ACEM and be below the median percentage for expected progress in both English and maths (74% and 67% respectively).
to be identified as coasting, a school would be getting less than 60% 5ACEM and be below the median percentage for expected progress in both English and maths
In effect, the new coasting definition is an uprating of the current floor standard, replacing the existing 40% 5ACEM with 60%.
Several questions immediately suggest themselves:
- Why, when just about anyone’s definition beforehand of “coasting” would have referred to students not making the progress of which they were capable, does the definition refer to attainment?
- Given that it’s there, where did the seemingly arbitrary figure of 60% come from? For comparison’s sake, in state schools in 2014, using the Wolf review criteria and the first entry rule, 56.6% of students reached the 5 ACEM threshold (SFR 02/15)
- Why does the definition use the widely discredited (and soon to be discontinued) measure of ‘expected progress’ when it could instead have used the much more meaningful ‘Best 8 value-added’ methodology which would also provide a more natural transition into the Progress 8 model in 2016?
- If a school achieves more than 60% 5 ACEM, does it not matter if its students are making below average progress? Can it not, by definition, be ‘coasting’?
Of course, any doubts about the criteria used would be insignificant if they succeeded in identifying schools which match the rule of thumb criterion of ‘students not making the progress they should’. So do they?
 Using our powerful Educational Outcomes database, we took the 2014 results of all state schools for whom data on prior attainment, attainment and value-added and expected progress was available.
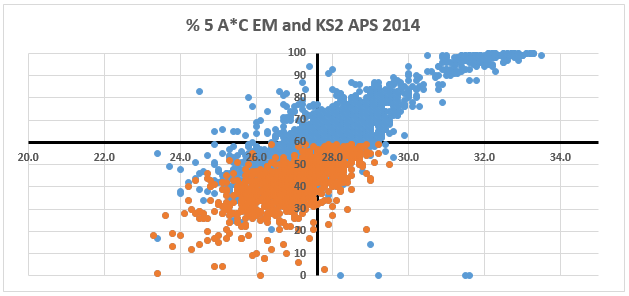
In 2014, we found that 1122 of these schools met the definition of coasting: their 5ACEM was below 60% and they were below the median for expected progress in both English and maths. They are shown in orange on the charts below.
The horizontal axis shows prior attainment at key stage 2 and the vertical axis shows 5 ACEM. The axes intersect at 60% 5 ACEM and 27.6, the national average prior attainment score.
The chart below shows the obvious correlation between attainment at KS2 and KS4. The orange swarm of ‘coasting schools’ also covers a wide range of prior attainment, both below and above the national average, although no school with a KS2 APS above 29.5 is considered to be coasting.
In 2014, we found that 1122 of these schools met the definition of coasting
There are also some schools in the bottom right hand quadrant (above average prior attainment but below 60% 5ACEM) who might have been expected to be included.
The second chart takes the same schools but this time compares 5 ACEM with each school’s best 8 value-added score for progress.
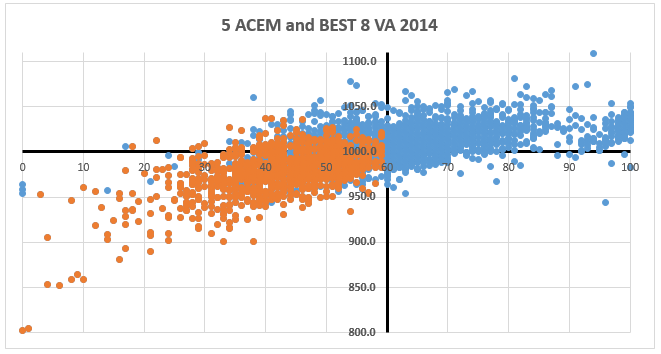
The intersection is now at 60% 5 ACEM and 1000 – the national VA average. Once again, the swarm of ‘coasting’ schools dominates the bottom left quadrant which contains schools where attainment is below 60% 5 ACEM and value-added progress is below average.
However, it also includes a large number of schools in the top left quadrant where, although their attainment is below 60%, their value-added progress is actually above (and, in many cases, significantly above) average.
These are schools where students are making exceptional value-added progress compared with other schools and probably from low starting points, but the combination of an attainment measure and the use of the narrow expected progress measures brings them into the category of a coasting school.
These are schools where students are making exceptional value-added progress… but the combination of an attainment measure and the use of the narrow expected progress measures brings them into the category of a coasting school
On the other hand, there is a large number of schools in the bottom right hand quadrant where progress is below and, in many cases, significantly below the national average.
They, however, are not included in the coasting definition because their attainment is above 60% 5 ACEM. Many would argue that schools where attainment appears to be high compared with national averages but where progress is low (and attainment, therefore, could and should be even higher) would meet an instinctive definition of coasting.
This third chart plots the same schools but this time compares prior attainment at key stage 2 with their best 8 value-added scores.
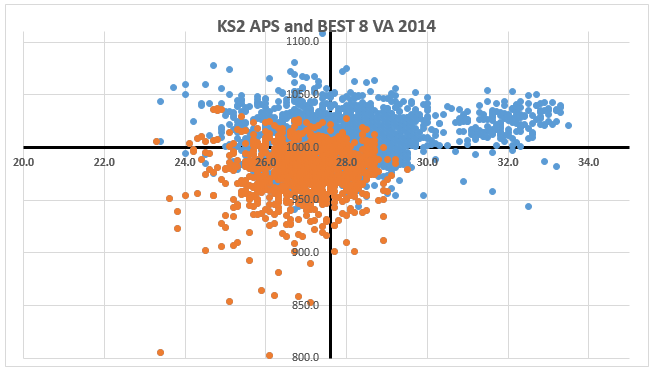
It confirms the view that the proposed coasting definition focuses disproportionately on schools with lower levels of prior attainment (left half), even when their students are making exceptional progress compared with their peers nationally (top left).
By the same token, many schools with higher levels of prior attainment (bottom right) are effectively given a free pass because their students reach an apparently acceptable level of attainment, despite not possibly reaching their potential.
many schools with higher levels of prior attainment are effectively given a free pass because their students reach an apparently acceptable level of attainment
It is early days with the proposed criteria for coasting schools: at the moment we only have one year’s data to go on whereas the final judgement will be based on a trend over 3 years; there will be a single criterion in 2016 – Progress 8, with no accompanying measure of attainment; and by 2018, the full three-year trend will be measured using Progress 8 alone.
All of which prompts the obvious question: why, if progress alone will be good enough by 2018, is it not good enough for 2014 and 2015 when there is a perfectly valid measure available? (English and maths are already double-weighted in best 8 value-added – the main difference between it and Progress 8 is that, like 5 ACEM, it does not require EBacc subjects to be included.)
why, if progress alone will be good enough by 2018, is it not good enough for 2014 and 2015 when there is a perfectly valid measure available?
Most schools would agree that, if over a three-year period, students were regularly making less progress than their peers, there was a case to answer.
Unfortunately, the current proposed definition threatens to breed accusations of unfairness from some while failing to put the spotlight on others.
Follow SSAT on Twitter: @SSAT
Find out more about SSAT’s Educational Outcomes database.
