
Double Trouble: What Ofsted reports tell us about doubled disadvantage for schools
21 May 2026
By Dr Keven Bartle
One of SSAT’s core values is a commitment to “achieving deep social justice”. This is one of the reasons why I am proud to work for them, having come from a disadvantaged background. In receipt of free school meals throughout my childhood, educational achievement helped me to become the first in my family to go to university. This, in turn, enabled me to become a school leader serving communities with high levels of economic disadvantage, a position from which I was able to contribute to social mobility.
My work with SSAT includes what I believe to be the most detailed tracking of inspection outcomes, with a view to assessing whether Ofsted does what it says on the tin. With the new inspection framework, launched in November 2025, the tin says that the aim of inspection is to hold schools more accountable for inclusive practices and notably for children who, like me, come from disadvantaged backgrounds.
As the new framework inspections have developed, SSAT’s Inspection Tracker now includes over 3000 ‘next steps’ for schools that have hosted Ofsted over the past six months. This means that the data have settled down into reliable patterns, and so I wanted to pay attention to how disadvantage for schools is playing out in the focus of inspection teams and the gradings that schools are receiving from Ofsted. I also wanted to look at the ‘next steps’ identified by inspection teams and whether these change the risk of inspection for schools serving communities with higher-than-average levels of disadvantage.
For the purposes of this blogpost, I will be identifying two cohorts of schools from the data produced about levels of disadvantage that accompanies inspection report. To the uninitiated, these data are about the proportion of students in the school eligible for free school meals (FSM) and the level of local deprivation (LD) of the school community. In both cases, schools are identified as being in one of five quintiles: well above, above, close to, below and well below national averages for these indicators.
The two cohorts of schools I will be looking at will be the ‘Doubly Disadvantaged’ (DD) and the ‘Doubly Advantaged’ (DA). Schools in the DD group are those with above or well above national levels of both FSM and LD. Conversely, schools in the DA group are those with below or well below national levels of both FSM and LD.
Inspection focus by doubled disadvantage and doubled advantage
SSAT’s Inspection Tracker summarises each of the ‘next step’ improvement needs identified by inspection teams on a school’s Ofsted report and links it to a specific area of the 2025 inspection framework. This gives us an indication of how frequently inspectors are using each of the seven core components of the framework in relation to the others.
In the left-hand column of data are the proportions for all schools, followed by the proportions for the Doubly Disadvantaged cohort of schools and then the proportions for the doubly advantaged cohort. I have then highlighted the cells in the middle two columns to indicate whether they are higher (red) or lower (green) than the proportion for all schools. And finally, I have added a column showing the gap between the proportions for the two groups.
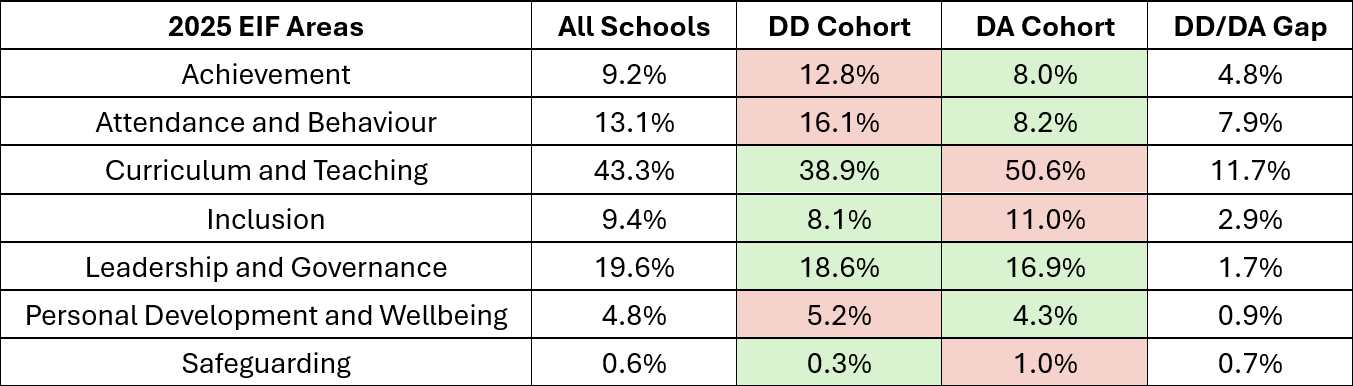
The biggest gap between the two cohorts where the DD cohort are more likely to see extra focus from Ofsted is, perhaps unsurprisingly, around attendance and behaviour. Schools with higher-than-average FSM and LD are twice as likely (1 in 6 next steps) as schools with lower-than-average FSM and LD (1 in 12 next steps) to have attendance and behaviour as an improvement need.
Achievement is the second biggest gap between the two cohorts where the DD cohort receive more focus than DA schools. As with attendance and behaviour, achievement appears as a next step for the doubly advantaged cohort at a rate of 1 in 12 of all next steps, whereas for doubly disadvantaged schools, achievement is referenced in 1 of every 8 next steps on reports.
Sticking with the theme of not being surprised, where the DA cohort are much more likely to see additional levels of attention by Ofsted is around the curriculum and teaching. For this cohort, curriculum and teaching appears in more than 1 in 2 next steps, with the figure being just shy of 1 in every 2.5 for the doubly disadvantaged cohort. I will mention here, and come back to it later, that whilst this aspect of the new framework is one of the most difficult to achieve well on, it is also the least risky judgement area for schools in terms of poor overall inspection outcomes.
The second biggest gap where the DA cohort comes under more scrutiny is around inclusion. Arguably, it is less surprising that schools with the most need for inclusive practice to tackle economic disadvantage within their student body and community are less likely to have it picked up as a next step by Ofsted. The data indicates that schools with a much smaller proportion of disadvantaged pupils (by family circumstance and within their wider community) may need to look again at support mechanisms for this minority within their midst.
But there are also a couple of potential surprises in the data above.
The first is that on the much riskier (i.e. more closely linked to poor outcomes across the graded areas) leadership and governance judgement area, both the DD and DA cohorts receive less attention from Ofsted than all schools. By contrast, the cohort of schools that are doubly close to the national levels of FSM and LD that we are not looking at in this blogpost, have 25% (1 in 4) of their next steps related to leadership and governance. Later in this post, we will look to unpack specific next steps to see if the parallels around frequency are matched by parallels around levels of risk.
The second area of arguable surprise is that doubly advantaged schools have, so far at least, come under more scrutiny for safeguarding concerns or failings than the doubly disadvantaged schools. For both cohorts, the frequency is thankfully rare but for DA schools this is 1 in 100 next steps, whereas for the DD cohort it is featured in fewer than 1 in 300 next steps. As with inclusion, there is an argument that schools facing higher levels of doubled disadvantage may be better equipped and/or more experienced in meeting and responding to safeguarding concerns than schools serving doubly advantaged communities.
Average Gradings by doubled disadvantage and doubled disadvantage
The second table underpinning this blogpost has a look at the outcomes from inspection activity filtered by the two cohorts of doubly disadvantaged and doubly advantaged schools. To do this, we have applied a numerical score for each of the new inspection gradings, with 5 being for the highest exceptional grade and 1 being for the lowest urgent improvement grade. As with the first table, we have aggregated the data for all schools and for each of the two cohorts we have identified. We have kept the colour-coding to indicate grading below (red) and above (green) the mean score for all schools. And, as before, we have included a final column to show the difference between the DD and DA cohorts.
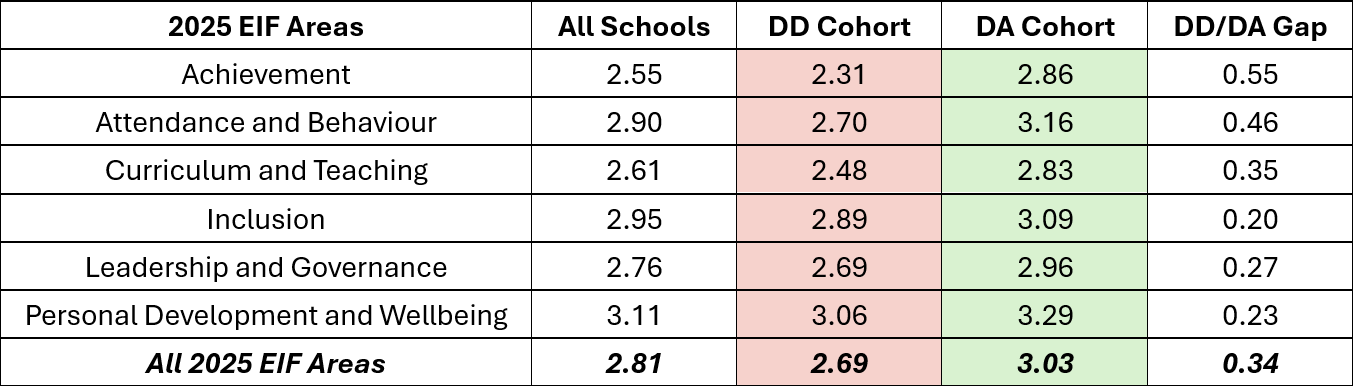
The most striking thing about this table is that the schools with doubled advantage have higher mean scores for all sections of the new Ofsted framework. The key column to focus on, therefore, is the final one to help us evaluate where the gaps are relatively larger or smaller between the two cohorts of schools.
In doing so, we can see that the biggest gaps are for those areas where Ofsted are more likely to focus their next step comments for doubly disadvantaged schools: achievement and attendance/behaviour. The gap around achievement is more than half an Ofsted grade in favour of the DA cohort of schools and the gap for attendance and behaviour is almost at half a grade, again in favour of the DA cohort.
The smallest difference between average gradings between the DD and DA schools is for inclusion, but even here schools serving doubly disadvantaged cohorts receive on average a fifth of a grade lower than schools with the doubled advantage of lower-than-average free school meals and local deprivation.
Across all inspection gradings for all areas, the DA schools score almost exactly a third of a grade higher than the DD schools. Converting the numbers back into judgements, this means that the DA cohort achieve an average of 3.03, which is marginally above an expected standard for each of the six judgement areas. The DD cohort achieve an average of 2.69, which is marginally higher than a school receiving two gradings of needs attention alongside four at expected standard. Extrapolating from evidence, it is likely that in many cases, those two lower gradings are for achievement and for attendance and behaviour.
Specific next steps by doubled disadvantaged and doubled advantaged
When we began tracking inspection reports, the focus was about how we can help schools focus on their readiness for their next inspection. The tables below show the top ten next steps (by frequency for each of the two cohorts discussed in this blogpost). The first column of data shows the frequency of the next step for the cohort and is followed by the mean grade across all judgements for that cohort for that next step. This column has been colour-coded with the red indicating that the mean grade is lower than the mean grade for any next step for that cohort (see the bottom line for this) and green where the mean grade for the next step is higher than the mean grade for any next step. Thus, any red cells are indicating a next step for the cohort that is both high frequency and relatively high risk.
I have added a final column that indicates the mean grade for that next step for the other cohort as a point for interesting comparisons. The spoiler alert is that for every next step in these top ten lists, the DD cohort has a lower average grading than the DA cohort.
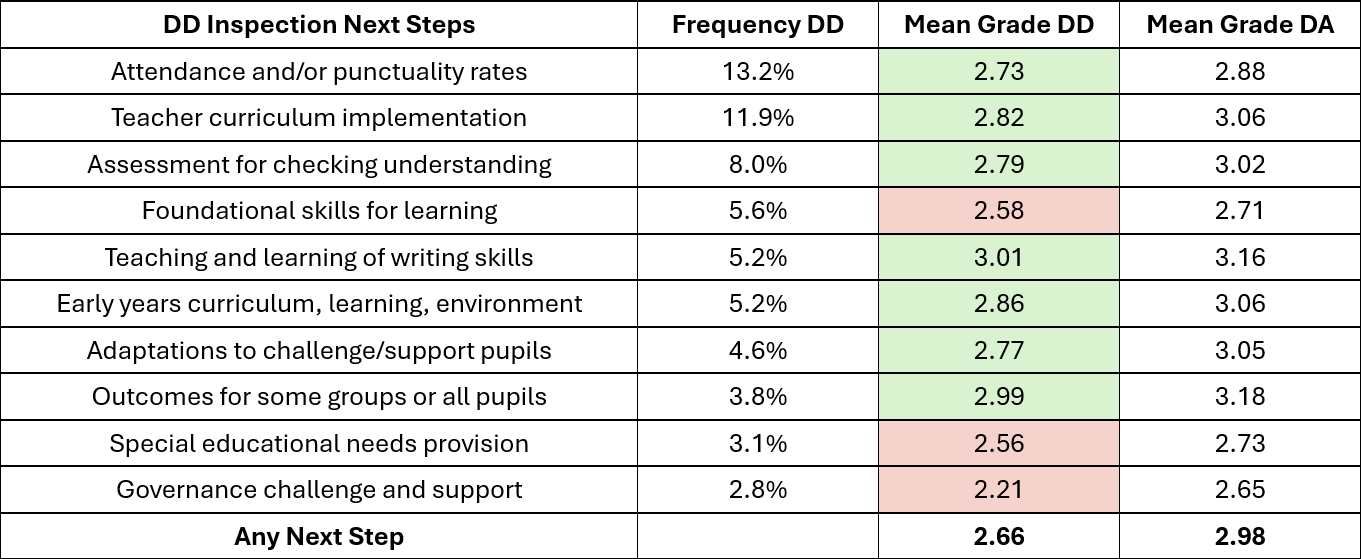
In terms of frequency, what jumps out for the doubly disadvantaged cohort is that attendance/punctuality is notably the most common identified next step by Ofsted and, if you look down to the table below you will see that this focus on attendance is easily more than twice as frequently identified for DD schools than DA schools. The final three entries on the list (outcomes, SEND and governance) do not make the top ten list for schools with below-national levels of deprivation.
Based on this list combining frequency and risk, three key areas of focus emerge for schools with higher-than-average levels of FSM and LD. Most notable amongst these is the quality of challenge and support from governing bodies for DD schools, as this is far close to an average ‘needs attention’ judgement than to an ‘expected standard’ one. SEND provision and the development of foundational knowledge and skills also point to pertinent challenges for the leaders of schools that would fit into this DD cohort.
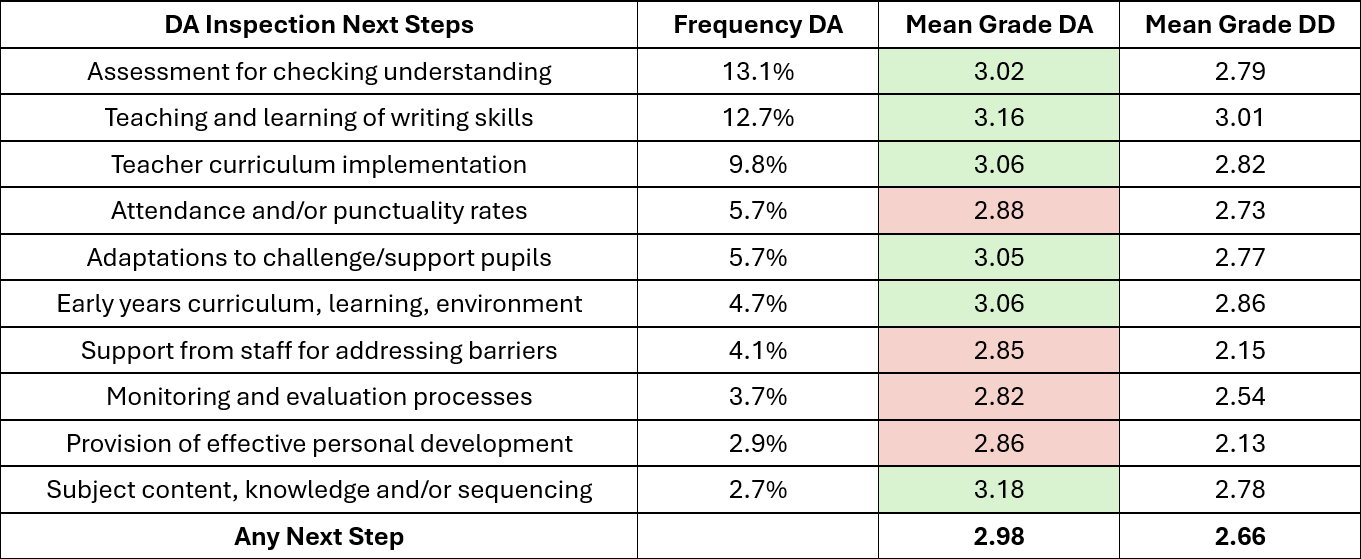
As to be expected from the first section of this post, next steps around curriculum and teaching hold four of the top five places for DA cohort schools in terms of their frequency. Perhaps more interesting is the fact that each of these is linked to much higher-than-average inspection judgements. High frequency plus low risk levels is a splendid combination for schools seeking to avoid lower than ‘expected standard’ judgements but it is worth noting that many of these schools may be seeking strong standards, in which case, it is worth such schools taking a hard look at formative assessment, adaptation and teacher delivery of the curriculum. Each of these have a mean grade a long way away from the strong standard.
There are four areas for doubly advantaged schools where there is a relatively high level of risk alongside a clearly high level of frequency. Intriguingly, all of these are around provision beyond the curriculum and teaching, and each is from a different section of the 2025 EIF framework. Whilst there are fewer concerns from these schools about the effectiveness of governance, it is worth leaders and governors of DA schools paying attention to the quality and impact of their monitoring and evaluation processes.
It would be remiss not to mention the gaps between DA and DD schools for each of these identified next steps. A stark way of summarising this pattern is that the same identified next step (whatever that next step might be) has far more negative impact on gradings for schools with above average deprivation than for schools with below average deprivation. Two of the areas where DA schools face next steps with high frequency and high risk – support for addressing barriers and personal development provision – are particularly salient. However risky and more frequent these next steps are for DA schools, the average judgement for DD schools with the same next steps are, on average, almost three quarters of a grade lower.
Conclusions
Ever since the new framework Ofsted inspection reports started landing, I have been interested (for reasons outlined in my introduction) in crunching the numbers around how disadvantage is playing out under a new framework that claims to be aiming to reduce the impact of disadvantage on students.
This blogpost suggests very strongly that there is a long way to go before that goal can be realised, which is perfectly understandable given the newness of the new inspection framework on the education scene. Instead, perhaps, what has been gifted to us is a benchmark by which we can, in the future, judge whether the 2025 inspection framework does indeed shift the dial on the chronic and chronically embedded effects of disadvantage for student outcomes.
What this post shows is that the first quarter of inspection activity is pointing clearly and loudly towards achievement and attendance as being of crucial importance for schools facing the double disadvantage of having cohorts which include high levels of free school meals and local deprivation. These two areas of the new framework are both much more commonly identified as next steps for DD schools and have the greatest impact on the grading differential between these schools and their doubly advantaged peers.
But the later sections of this post also show that that grading differential is visible across all six core graded areas of the framework for all schools and even for each one of the most frequent individual next steps. These differentials can be as large as three-quarters of a grade, meaning that there is an in-built disadvantage across all areas of the framework for those schools who are already doubly disadvantaged by the needs of their community of children and the wider community of which they are a part.
At SSAT, we will continue to use our inspection tracker over the months and years to come to see whether, crucially, this inspection framework’s focus on inclusion is going to be simply a way of seeing the yawning gaps within our education system and society, or whether it will be a game-changer in helping us to close those gaps. I sincerely hope that it will be the latter of these two, but I’m not holding my breath.
Readiness for Inspection: Insights for school leaders
Is your school in the inspection window? Do you know which aspects of the inspection framework carry the greatest risk for schools and their leaders? Have you wondered what inspection reports can tell you that will help your preparation? You are in the right place.
Dr Keven Bartle, Senior Education Lead, SSAT

Keven has been a teacher for almost three decades and was headteacher at a richly diverse secondary school in London for nine years. Through his career, Keven has been committed to the power of education for social justice and transformation, working in schools where staff make a difference to the lives of children, families and communities.
Recommended
Readiness for Ofsted Inspection Audit Tool
Set your school or MAT up for success with the new Ofsted framework. Our invaluable new audit tool for school leaders ensures you are fully prepared when your call comes.
Ofsted Inspection Insights
We have the data from every Ofsted inspection ready for you. Learn the emerging trends and the issues facing schools with our comprehensive, segmented analysis of inspection reports.
ASSIST
If you need rapid, focused improvement right now, we can support you with a bespoke, hands-on, strategic programme tailored to your specific needs.
School improvement solutions
Working sensitively within your context, we work with you and your team to support you to overcome the different challenges you are facing. From attendance and behaviour, working with parents to DEIB and more.
Framework for Exceptional Education
Wherever you are in your school improvement journey our trusted framework supports self-review and action planning. Covering 12 key areas of practice.
Back to top